
Every trading day, the news lights up with stocks surging 20–30% in a session. The instinct — “should I jump in before it runs further?” — is natural. But buying a stock without knowing whether it’s cheap or expensive, or whether the company even makes money, isn’t investing; it’s a bet. The first thing to open when you meet a surging stock is its valuation metrics. Valuation metrics help you gauge, in numbers, where the current price sits relative to the company’s earnings, net assets, and profitability. This guide explains PER, PBR, and ROE from scratch, then shows a step-by-step framework to vet a surging stock yourself.
The one-line version: how many times earnings (PER) the price is, how many times net assets (PBR) it is, and how efficiently the company turns capital into profit (ROE) — reading these three valuation metrics together helps screen out many hype-driven surges. Add EPS, BPS, and dividend yield as supporting valuation metrics and the picture is complete. The key is never reading one metric alone, but cross-checking several valuation metrics.
Why surging stocks make valuation metrics essential
A price surge means “many people bought,” not “the company got better.” When theme, flows, or news push the price alone, valuation metrics shoot into overvalued territory unless earnings follow. Freshly surged names often carry PERs of dozens to hundreds — a sign the market may have already pulled forward years of future profit into today’s price.
So when you face a surging stock, valuation metrics act as a brake. A green candle excites; valuation metrics ask the cold question: “is this price justified by fundamentals?” The same 30% jump means very different things for an undervalued, profitable company versus a loss-making theme play. Telling them apart is exactly what valuation metrics are for.
PER — how many times earnings is the price
PER (Price-to-Earnings Ratio) is the most widely used of all valuation metrics. The formula is simple:
PER = Price ÷ Earnings Per Share (EPS) = Market cap ÷ Net income (conceptual formula). In practice the value shifts with which earnings you use — trailing twelve months (TTM), the last four quarters of controlling-interest net income, or forward (estimated) EPS — so the reference period differs by data source.
A PER of 10 intuitively means that, assuming today’s earnings hold and all of that profit accrues to shareholders, the price equals about 10 years of annual earnings. Generally, a lower PER signals undervaluation relative to earnings, while a higher PER reflects overvaluation or high growth expectations. There’s no absolute threshold — it only means something against the industry average or the company’s own history. Growth stocks often trade at high PERs, while mature sectors like banks and telecom tend to show relatively lower ones.
Remember two traps. First, PER is meaningless for loss-making firms (you can’t divide by negative earnings). Second, a one-off gain (asset sale, etc.) can temporarily inflate net income and make PER look deceptively low. “Low PER, so it’s cheap” only holds after clearing these two traps.
PBR — how many times net assets is the price
PBR (Price-to-Book Ratio) compares price to the company’s net assets (equity):
PBR = Price ÷ Book value per share (BPS) = Market cap ÷ Equity
A PBR of 1 means the market value is roughly equal to book equity. A PBR below 1 can be an undervaluation clue — the price is low relative to book net assets — but actual liquidation value depends on how sellable the assets are, plus debt, taxes, contingent liabilities, and industry conditions, so you should not jump to “trading below liquidation value.” A high PBR means the market may expect higher future profitability or growth than the book assets suggest — though it can also stem from overheated expectations, a thin equity base, or sector characteristics, so read it together with ROE, growth, and the debt ratio.
PBR isn’t foolproof either. Sectors with large book assets (factories, real estate, financial assets) and sectors driven by intangibles (brand, technology, network effects) call for different PBR interpretation, so PBR is safest compared within the same sector. That’s why PBR should be read alongside ROE — a company that compounds capital well (high ROE) can command a relatively higher PBR.
ROE — how efficiently capital is put to work
ROE (Return on Equity) measures how much profit a company generates in a year from shareholders’ money (equity):
ROE = Net income ÷ average Equity × 100(%) (the average of beginning and ending equity is standard)
An ROE of 15% means “over the period, it earned about 15% on shareholders’ equity.” There’s no absolute cutoff — if it stays consistently above the industry average, that’s a clue the business uses capital efficiently. If PER and PBR ask “is the price cheap or expensive,” ROE asks “is this a good business in the first place.” That’s why value investors pair PBR with ROE — a higher ROE can warrant a higher PBR, but the fair PBR also depends on growth, cost of equity, payout ratio, and sector characteristics, not ROE alone.
The ROE trap: heavy debt shrinks equity and can inflate ROE. If ROE suddenly jumps, check the debt ratio too. A one-off profit also spikes ROE temporarily, so read it as a 3–5 year trend.
EPS, BPS, dividend yield — supporting valuation metrics
A few supporting valuation metrics round out the picture:
| Metric | Formula | What it shows |
|---|---|---|
| EPS (earnings per share) | Net income ÷ shares | Profit per share. Rising EPS = growing earnings |
| BPS (book value per share) | Equity ÷ shares | Net assets per share. The denominator of PBR |
| Dividend yield | Dividend per share ÷ price × 100 | Cash return relative to price |
EPS is the denominator of PER and BPS of PBR, so they travel together. Note that the formulas above are simplified for beginners; real investment-metric screens often use shares outstanding excluding treasury stock, a weighted-average share count, or controlling-interest net income. Because the formula and reference period can differ by data provider, stick to one source when comparing numbers.
Dividend yield matters more for stable cash flow than for surging stocks. It can also vary depending on whether it is based on the prior year’s dividend, the current price, or an expected dividend — and beyond the yield you should also check the payout ratio, dividend durability, and the risk of falling earnings. The dividend strategy itself is covered in our dividend investing guide. For a deeper standard reference on PER, Investopedia’s P/E Ratio explainer is the go-to.
A step-by-step framework for surging stocks (Steps 0–5, worked example)
Now the practical part. Below are hypothetical surging stocks A, B, and C — illustrative figures, not real tickers. The same “up 30% today” looks completely different once you open the valuation metrics. Note that, depending on the data screen, a loss-making company or a negative ROE may show as N/A or “not available” rather than a minus figure.
| Hypothetical stock | PER | PBR | ROE | Read |
|---|---|---|---|---|
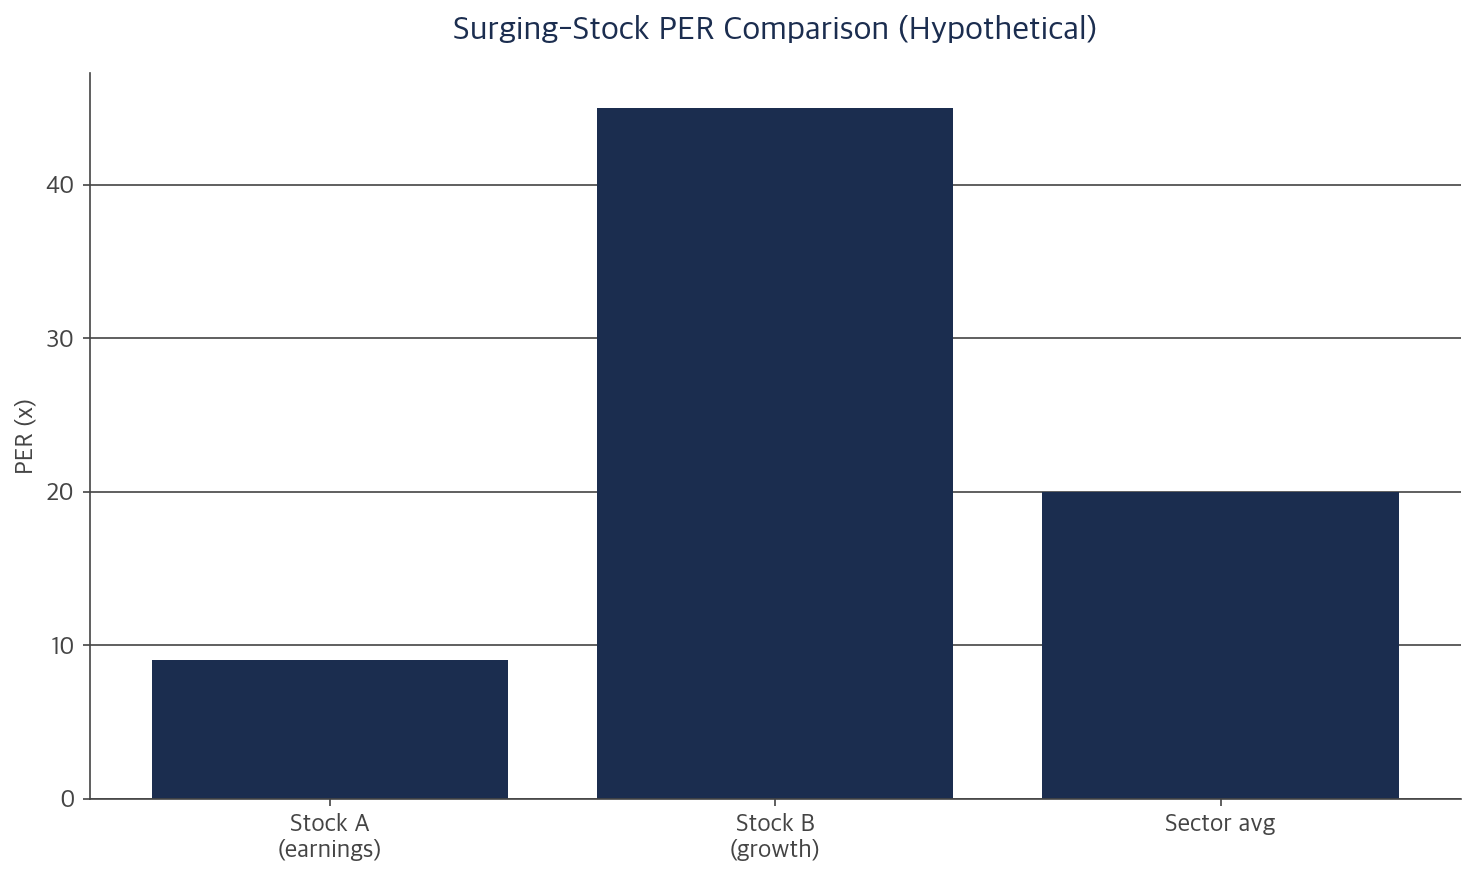
| Stock A (earnings) | 9x | 0.8x | 14% | Metrics look relatively undemanding, but still verify earnings durability, one-off gains, sector average, and disclosures |
| Stock B (growth) | 45x | 6x | 18% | Pricey but capital-efficient. Growth must continue |
| Stock C (theme) | Loss (N/A) | 11x | -7% | Loss + high PBR. Weak fundamental basis |
Start at Step 0 (market alerts), then read the table in this order.
- Step 0 — check market alerts: for a surging stock, first check KRX/KIND for investment-caution, investment-warning, or investment-risk designations. Alerted stocks may carry short-term overheating or possible unfair-trading concerns, and especially at the investment-warning and investment-risk levels they can face added risks such as margin-trading limits, restrictions on using the stock as substitute collateral, and trading suspension if certain conditions are met — so approach them more conservatively than ordinary stocks.
- Step 1 — profit or loss (EPS): a negative EPS means no PER. Like Stock C, a loss-maker needs a separate “why is it rising (theme/expectation)” check; the fundamental basis is weak. For a loss-making growth stock, look instead at PSR (price-to-sales), revenue growth, operating cash flow, cash on hand, and the possibility of convertible bonds or new share issuance.
- Step 2 — PER for price vs earnings: A looks relatively undemanding on price versus earnings, while B may already price in high growth expectations. Either way, compare against the sector average, the company’s own PER history, the earnings cycle, and forward EPS.
- Step 3 — PBR for price vs assets: A at 0.8x looks low in market value relative to book equity; C is loss-making yet at 11x PBR, so its price looks demanding relative to assets too.
- Step 4 — ROE for company strength: A and B at 14–18% are solid; C at -7% is burning capital. A negative ROE is a caution flag even if steps 1–3 looked fine.
- Step 5 — cross-check: A shows low PER, low PBR, and a solid ROE together, which makes it relatively more worth a closer look — but that alone is not a buy conclusion. B is pricey, and its high ROE can be part of the explanation rather than a justification to buy; C flashes red on all three. Same surge, different verdicts.
The point is to never conclude from a single metric. PER alone makes A look like the answer, but cross-checking PBR and ROE makes the direction of further review clearer and helps screen out higher-risk candidates.
Five common traps when analyzing surging stocks
- Justifying a high PER as “it’s growth”: if growth stalls, a high PER becomes downside. Check the growth basis (revenue and EPS trend) too.
- Applying PBR alone to a loss-maker: with no earnings, a low PBR can be a value trap. Check whether ROE is negative first.
- Being fooled by one-off PER/ROE: asset sales or FX gains can spike one year’s profit and flatter the metrics. Verify on a 3–5 year trend.
- Absolute comparison across sectors: don’t judge IT’s 6x PBR by the same yardstick as a bank’s 0.5x. Compare within the same sector.
- Mistaking trailing metrics for the future: reported PER is based on past results. If the surge is about future earnings, also check forward (consensus) estimates.
Where to check a real surging stock’s valuation metrics
This article recommends no specific stock. Instead, here is where to get the data so you can analyze today’s actual surging stocks yourself — keeping in mind that the sources differ in nature: DART is for checking the original filing, the KRX/KIND investment indicators are reference figures provided from disclosed financials and prices, and a finance portal is convenient secondary data.
- Find the movers: use the change-rate ranking on the KRX Information Data System, or a brokerage/portal “top gainers” screen for the day.
- Scan the metrics quickly: a Korean finance portal page or the KRX/KIND investment-indicator screen lists PER, PBR, ROE, EPS, BPS, and dividend yield together. Keep in mind a portal is secondary data, and even KRX/KIND indicators are reference figures computed from disclosures.
- Verify at the source: if a number looks off (e.g., a suspected one-off gain) or matters to your decision, read the consolidated financial statements and footnotes in the annual/quarterly report on DART (Korea’s electronic disclosure system).
- Compare to peers: line up PER, PBR, and ROE for 2–3 competitors in the same sector.
- Check forward estimates: if the surge is about future earnings, look at brokerage consensus (estimated EPS).
Always remember these metrics are trailing, based on past results. For volatile names like surging stocks, diversification is the baseline defense — and ETFs as a diversification tool are covered in our ETF investing guide. That said, ETFs also carry the risk of principal loss from market price swings.
Frequently Asked Questions
Q. If I could watch only one of these valuation metrics?
If forced to pick one, ROE. It can be a clue to “is this a good business.” But if the stock is already expensive, or if ROE is distorted by heavy debt or a one-off gain, a high ROE may not translate into a good investment. Since ROE alone won’t tell you whether today’s price is expensive, in practice always pair it with PER and PBR.
Q. Is a low-PER stock always a buy?
No. A low PER can exist for a reason (declining industry, one-off profit, governance risk) — this is the “value trap.” Confidence only rises when low PER, low PBR, high ROE, and earnings growth all line up together.
Closing — valuation metrics are the thermometer for surge fever
The biggest danger in front of a surging stock is the fear of missing out. Valuation metrics counter that with three questions — expensive vs earnings (PER), expensive vs assets (PBR), and a good business at all (ROE). Just building the habit of cross-reading these three screens out a large share of hype surges. Metrics are not answers but the starting point of questions, and the safest move is to scan quickly on a finance portal or KRX/KIND, but to verify any number that matters to your decision against the financial statements and footnotes in the annual or quarterly report on DART.
Disclaimer: This article is for investment education and informational purposes only and is not a recommendation to buy or sell any specific security. Stocks A, B, and C and all figures here are hypothetical examples for illustration and bear no relation to real tickers or results. Valuation metrics such as PER, PBR, and ROE are trailing indicators based on past results and do not guarantee future returns. All investment decisions are your own responsibility; verify current filings and financials directly on sources like the KRX Information Data System and DART before investing.